Shiny App

Percentage Change in Young Female Population 1980-2020.
In response to the news "Eventual Extinction of Japan's municipalities" by the Population Strategy Council, I developed the web app that visualizes the percentage change in the female population aged 20-39.
Percentage Change in Young Female Population 1980-2020 (若年女性人口変化率1980-2020)
https://keisuke-kondo.shinyapps.io/female-population-japan/
Population Strategy Council. "Municipality Sustainability Analysis Report." (in Japanese) https://www.hit-north.or.jp/information/2024/04/24/2171/ (Accessed on April 26, 2024).
NHK World News. "Experts warn of eventual extinction of Japan's municipalities." April 25, 2024.

Regional Attractiveness Index Visualization System
This shiny app visualizes the regional attractiveness index, estimated from the Mobile Spatial Statistics® of NTT DOCOMO.
Regional Attractiveness Index Visualization System (地域魅力度指数可視化システム)
https://keisuke-kondo.shinyapps.io/regional-attractiveness-japan/
Kondo, K. Measuring the Attractiveness of Trip Destinations: A Study of the Kansai Region of Japan. RIEB Discussion Paper Series No.2023-07 (2023).
https://www.rieb.kobe-u.ac.jp/academic/ra/dp/English/dp2023-07.html
Bronze Award (General Category) in 2023 Urban Data Challenge with 2023 Infrastructure Data Challenge. Link (jp)

Regional Attractiveness Index in the Kansai Region of Japan
This shiny app visualizes the regional attractiveness index proposed by Kondo (2023). The indices are estimated from the 2010 Person Trip Survey and the Mobile Spatial Statistics® of NTT DOCOMO in the Kansai region of Japan.
Regional Attractiveness Index
https://keisuke-kondo.shinyapps.io/regional-attractiveness-kansai/
Kondo, K. Measuring the Attractiveness of Trip Destinations: A Study of the Kansai Region of Japan. RIEB Discussion Paper Series No.2023-07 (2023).
https://www.rieb.kobe-u.ac.jp/academic/ra/dp/English/dp2023-07.html

Administrative Boundaries in Japan
This web app visualizes historical administrative boundaries in Japan, which is the supplementary material of Kondo (2023).
Administrative Boundaries in Japan
https://keisuke-kondo.shinyapps.io/administrative-boundaries-japan/
Kondo, K. (2023) Municipality-level panel data and municipal mergers in Japan, RIETI Technical Paper No.23-T-001.
https://www.rieti.go.jp/en/publications/summary/23020001.html
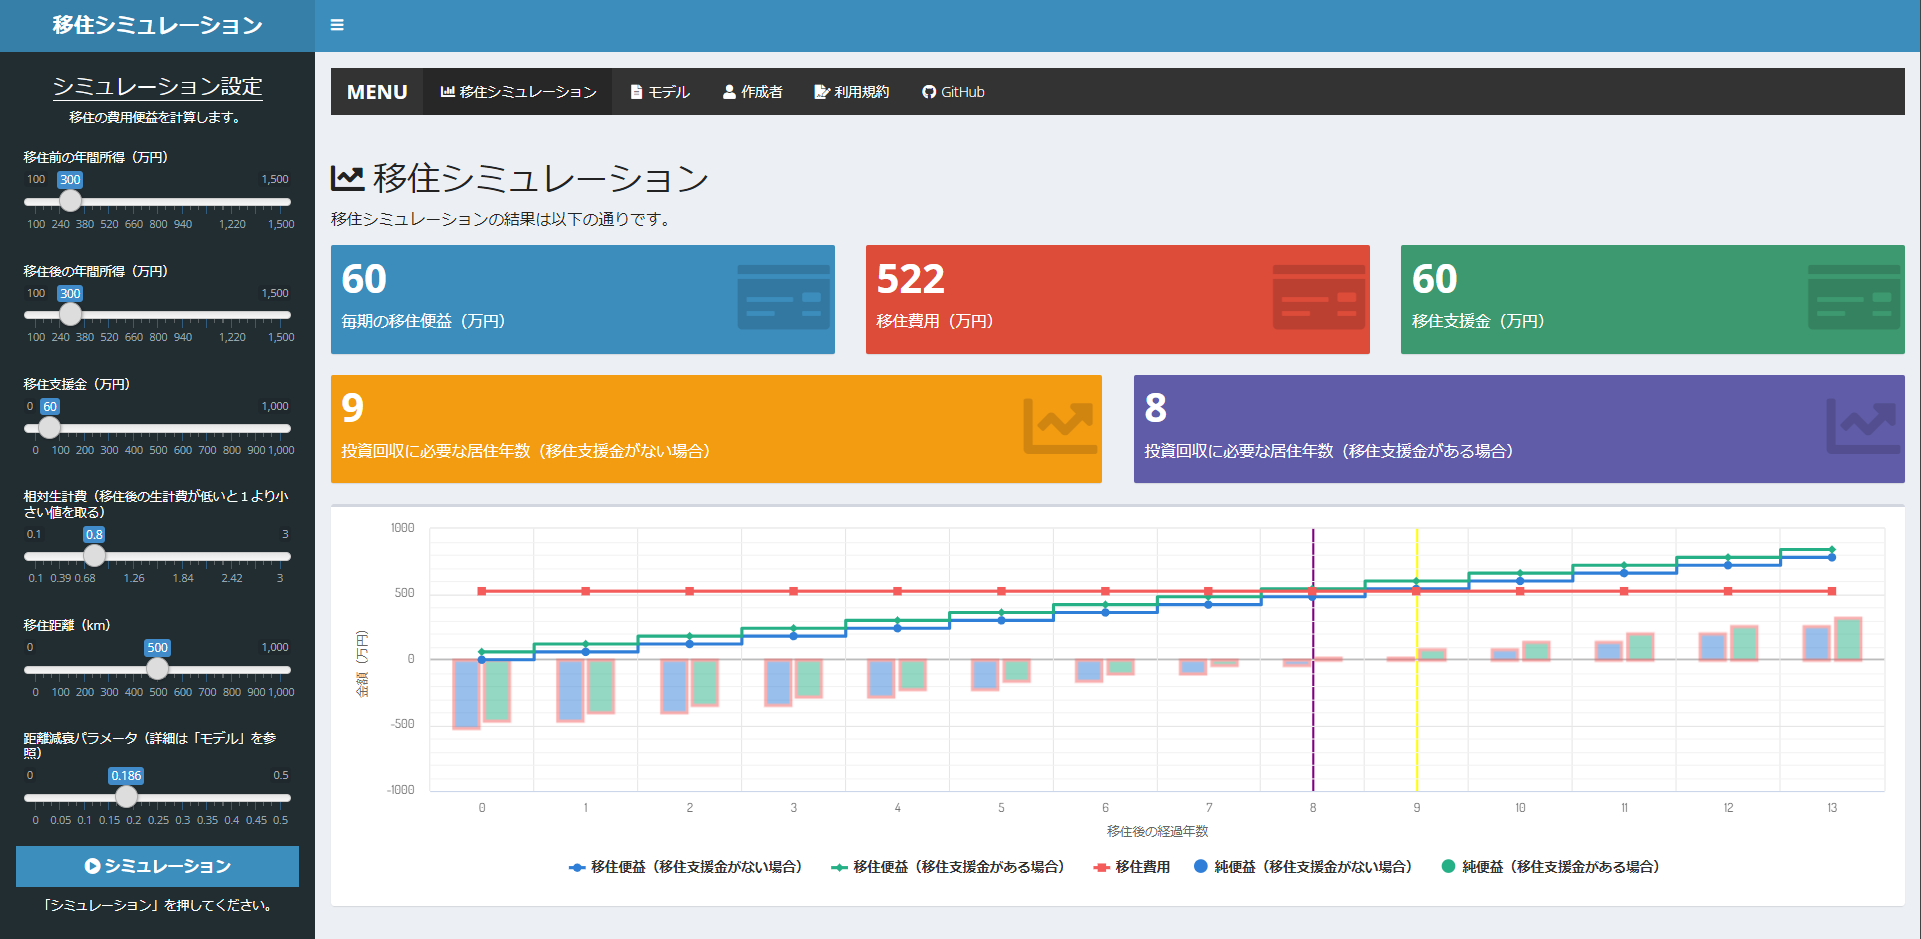
Migration Simulator
This shiny app examines the costs and benefits of interregional migration in Japan.
Migration Simulator (en)
https://keisuke-kondo.shinyapps.io/migration-simulator-en/
Migration Simulator (jp)
https://keisuke-kondo.shinyapps.io/migration-simulator-jp/
Kondo, K. Ex Ante Evaluation of Migration Subsidy: Evidence from Japan. RIETI Policy Discussion Paper No. 22-P-031 (2022). https://www.rieti.go.jp/en/publications/summary/19040007.html

COVID-19 Simulator in Japan
This shiny app visualizes simulation results of the spatial spread of COVID-19 obtained from the spatial SEIR model with interregional mobility in Japan. See Kondo (2021) for more details.
COVID-19 Simulator in Japan
https://keisuke-kondo.shinyapps.io/covid19-simulator-japan/
Kondo, K. Simulating the Impacts of Interregional Mobility Restriction on the Spatial Spread of COVID-19 in Japan. Scientific Reports 11, 18951. (2021). https://doi.org/10.1038/s41598-021-97170-1
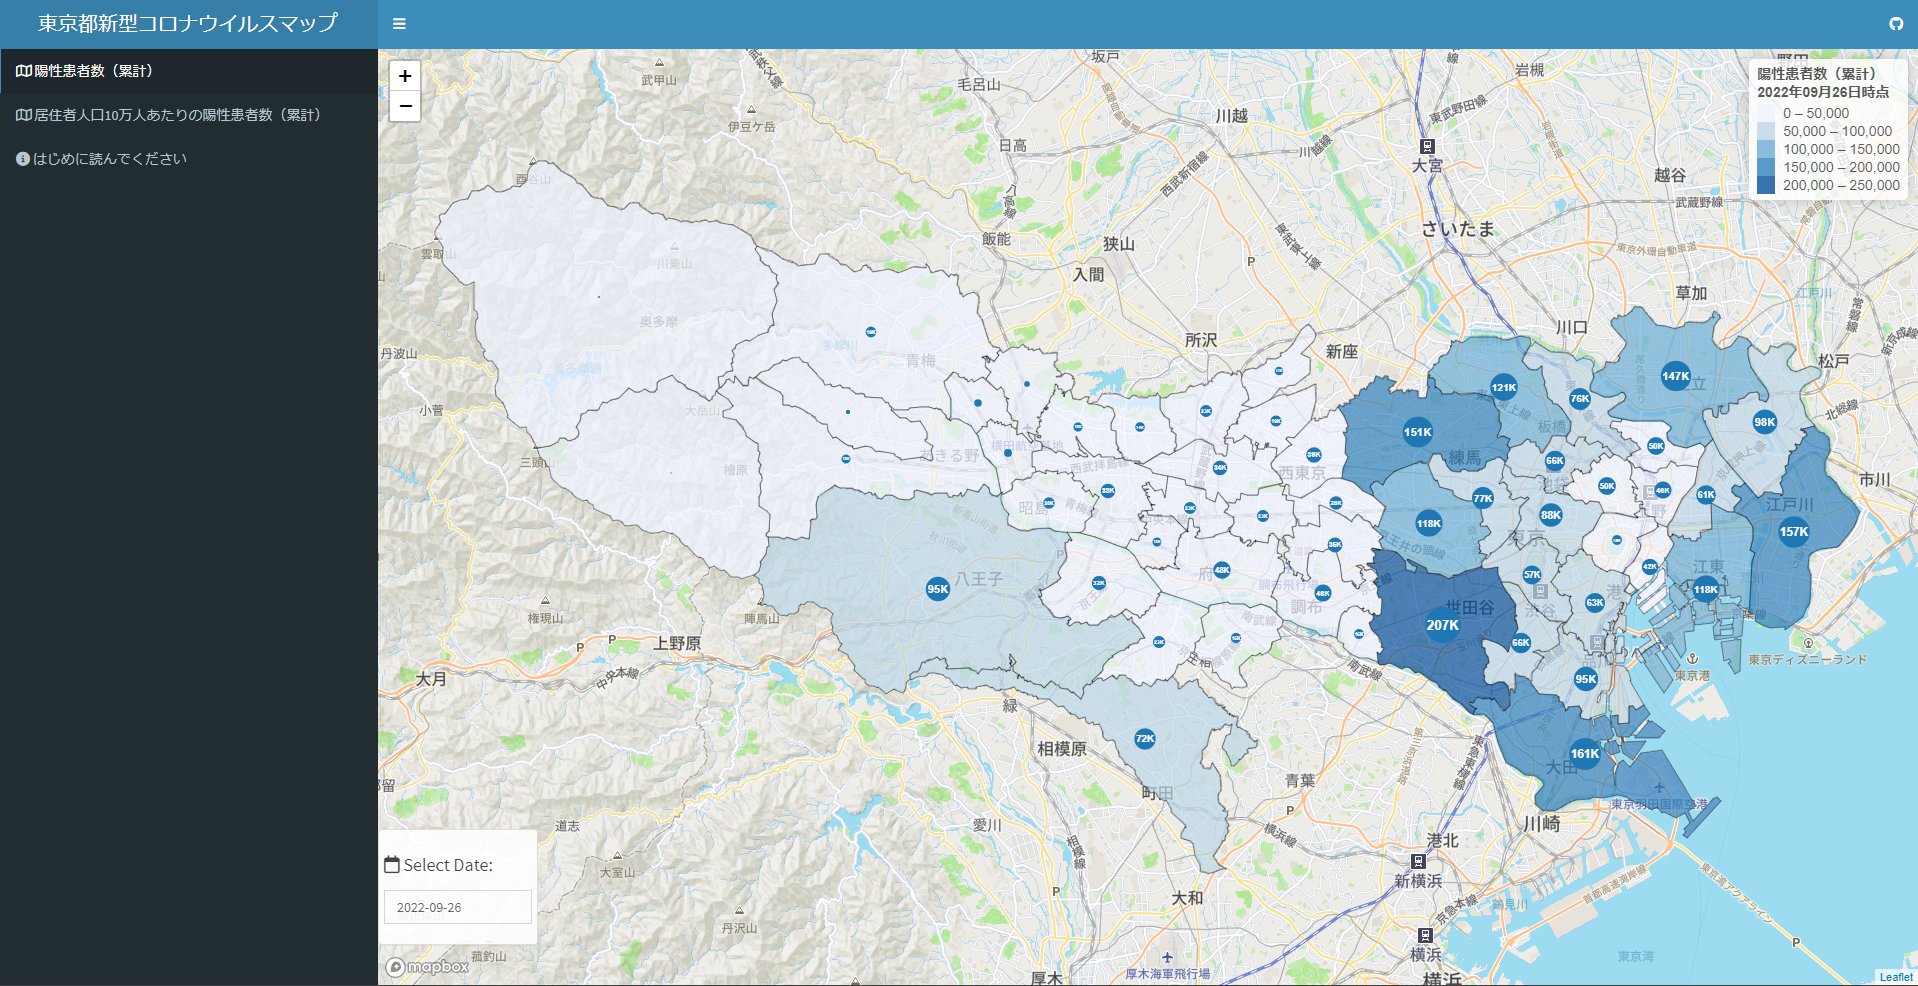
COVID-19 Map in Tokyo
This shiny app visualizes the geographical distribution of COVID-19 infections in Tokyo.
COVID-19 Map in Tokyo (東京都新型コロナウイルスマップ)
https://keisuke-kondo.shinyapps.io/stopcovid19tokyo/
The renewal of municipal data was terminated as of September 26, 2022.